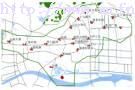
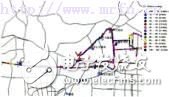
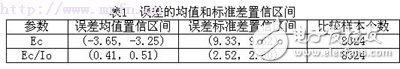
Combined with the case, the network simulation results of ZTE WCDMA are compared with the test network test results. The analysis results show that the error of the two can be controlled within an acceptable range, which proves that the WCDMA network simulation results have important guiding significance for the planning and optimization of WCDMA networks. Wireless network planning has guiding significance for carrier network construction. Good planning can successfully achieve a good balance between network coverage, capacity, quality and network construction cost, and assist operators to adopt the best implementation plan in each stage of network construction and upgrade and expansion to maximize the benefits of network construction. . Planning simulation is an important part of the network planning process. Through simulation, some important performance parameters of the planned network, such as pilot coverage, optimal cell, system load, and handover area, can be obtained, which have important guidance and reference for the actual networking. In order to evaluate the accuracy of the simulation, ZTE conducted repeated comparative analysis of the results of the network simulation and the test data of the test network in several test networks at home and abroad. The results show that under the premise of correctly selecting the simulation parameters and operating according to the standardized simulation process, the error between the network simulation results and the road test results is kept within an acceptable range. This proves that network simulation tools can be used to guide the planning and optimization of WCDMA networks. Because WCDMA systems introduce multiple types of data services, the complexity of the entire network service characteristics greatly exceeds the traditional 2G wireless network, which mainly focuses on voice services and assists with a small amount of low-speed data services. Under the same conditions, different services cover different areas; under different business and business composition ratios, the required system capacity also has a big difference. On the other hand, WCDMA systems have the characteristics of soft capacity, which is inherently power limited, associated with power, and the relationship between power variation and user number and data throughput is non-linear and variable. The existence of soft capacity brings difficulties to WCDMA network planning, and it is difficult to determine how to provide sufficient system capacity by simple formula calculation. Therefore, in network planning, specific WCDMA network planning tools are often required to evaluate the planning results. Using simulation tools, we can obtain more accurate system capacity coverage analysis results by simulating the system work process, so as to reasonably estimate the network scale and investment scale, and find the best balance between capacity, coverage and different service quality. In the simulation, as a necessary input condition, it is usually necessary to obtain information such as the geographical environment, geomorphology, humanities, economic level, etc. of the planned area, among which the wireless communication model, service distribution and growth characteristics, business model and traffic model are Establishment is especially critical. The more precise these input parameters are, the better the credibility of improving the planning results. However, it needs to be clear that whether the network size estimation is carried out by theoretical methods or the collection and statistics of the test network model of the existing network, the simplified analysis of the model will inevitably be carried out during the operation, and many parameters are involved. Value problem. Many engineering parameters often fail to give their exact values, usually using industry experience values ​​or literature recommendations. These factors will cause the simulation results to differ to some extent from the measured values ​​of the real network. In order to evaluate the magnitude of this difference, that is, to verify the accuracy of the output of the simulation tool, a comparison between simulation and actual measurement is required. On the contrary, in the initial stage of planning, through comparison, it can also verify whether the setting of some important wireless parameters in the simulation is correct or not, and improve the simulation accuracy by adjusting the parameters. First understand the data storage format. If the accuracy of the electronic map used in the simulation is 20m, each 20m & TImes on the map; 20m geographical area is called a bin, that is, a grid point. The current network measurement data and simulation data are stored in bins. The comparison between simulation and actual measurement needs to be done by putting the two data together and comparing the degree of their fitting, as shown in Figure 1. Figure 1 Schematic diagram of simulation and measured data comparison ZTE independently developed a tool for comparing simulation with actual measurement. Generally, it can complete the statistical analysis of the overall error mean, standard deviation, probability distribution function PDF, probability cumulative distribution function CDF, confidence interval, etc. of the planned area, and intuitively analyze the network. The alignment error results of the parameters are visually displayed in the mapinfo map. This information is sufficient to objectively evaluate the results of the simulation. From the analysis of network key performance indicators (KPIs), the network parameters that usually need to be compared include pilot strength Ec and pilot quality Ee/Io. At present, ZTE has widely used simulation to guide the construction of the network in its trial networks, and has played a significant role in the network pre-planning phase and network optimization phase. The comparison between simulation and actual measurement is not only to verify the guiding role of simulation, but more importantly, to sum up experience, learn lessons, and improve the precision of simulation in repeated practice. The trial network built by ZTE in various places provides the best practice platform. While continuously improving the simulation level, it also continuously proves the importance of simulation. Currently, the industry's common simulation software includes Aircom, Planet, Atoll and so on. ZTE mainly uses Aircom software. In the following, combined with the measured data of the test network, taking Ec as an example, the quantitative comparison results between simulation and actual measurement are given. The simulation data in the example was obtained from Aircom's *.3ga file, while the drive test data was taken from the SD5 file exported by the Agilent Road Tester. For example, the propagation model used in a test network simulation of ZTE is the following general model expression: Path_Loss=K1+K2log(d)+K3(Hms)+K4log(Hms)+K5log(Heff)+K6log(Heff)log(d)+K7(DiffracTIon Loss)+Clutter_Loss Among them: K1-K7 values ​​are 153.23, 40.23, -2.88, 0, -13.82, -6.55, 0.8. The base station distribution of the test network is shown in Figure 2. Figure 2 Test site point distribution map Through the network simulation, the coverage effect of Ec can be obtained, as shown in Figure 3. The actual road test results are shown in Figure 4. Figure 3 test network Ec simulation renderings Figure 4 test network test results A total analysis of all the data on the test route, a total of 8324 valid error samples, the mean and standard deviation of the error can be calculated by -3.45dB and 9.47dB, respectively, the error distribution histogram is shown in Figure 5 and Figure 6. Show. Figure 5 Ec error distribution PDF histogram Figure 6 Ec error distribution CDF histogram It can be seen from the comparison result data that under the propagation model and simulation conditions used, the mean value of Ec error is distributed within a reasonable range, and the standard deviation of Ec error is about 9 dB. It can be seen from the mean of the Ec error that the prediction result of Ec is generally slightly smaller than the road test result. This shows that the simulation results are closer to the real network conditions. According to the mean and standard deviation of the test data comparison results, the confidence interval of the mean and standard deviation of the entire network planning simulation can be inferred under certain confidence. Under the 95% confidence probability, the mean and standard deviation of the error are shown in Table 1. Due to the complexity of the wireless channel environment, the above comparison results are within acceptable limits. The accuracy of the simulation can be made more precise by adjusting the simulation parameters, especially the further refinement of the propagation model. As a result of the modeling of the simulation parameters, it is inevitable that some geographical predictions and actual measurements are in good agreement, and some regions are slightly inferior. When conditions permit, consider using multiple propagation models for the planning area to make the scope of the model more detailed. At the same time, by adopting the standard propagation model test and correction method, the model can reflect the propagation characteristics of the planning area as realistically as possible, thus improving the simulation accuracy. On the other hand, with the aid of the comparison tool, the error distribution of each road segment can be seen relatively intuitively, and then the simulation parameters are adjusted, so that the error between simulation and actual measurement is reduced as much as possible, and the network construction and optimization are better guided. From the data of the trial network, the results of the error are acceptable. Moreover, ZTE will sum up the experience after each simulation. If the simulation results are poor, compare the simulation process with the previous successful simulation, find out the difference and adjust, and the new simulation results. Compare with the measured data again, so repeatedly adjust and contrast, find out the rules of the simulation parameters affecting the results, and summarize the mature parameter settings suitable for the local situation, so that the accuracy of the simulation is steadily improved. At the same time, simulation and actual measurement comparisons have also been applied to network optimization. In order to make the simulation play a greater role in network optimization, the latest road test data can be used to compare with the simulation results. According to the results, the simulation parameters are finely adjusted, so that the simulation is as close as possible to the measured data, and then the local is summarized. The principle of wireless parameter setting. Then, before the network parameters are adjusted, the simulation effect can be observed, the adjusted network performance can be analyzed, and the adjusted network performance can be analyzed to provide data for network optimization work. Compared with the actual measurement, the simulation is no longer a one-time work, but it is based on the road test data, iteratively, continuously improved, and constantly close to the actual situation, thus complementing the network optimization work, greatly improving the efficiency of network optimization. Fluum ,Fluum bar Fluum 5500puffs ,Fluum 6000Puffs Nanning Nuoxin Technology Co., LTD , https://www.nx-vapes.com